ABOVE: Chernobyl 2012: the highly radioactive graphite crane claw.
166-200+ CPMs.
REMEMBER THESE NUMBERS, 160 TO 200 CPM.
166-200+ CPMs.
REMEMBER THESE NUMBERS, 160 TO 200 CPM.

RADIATION'S EFFECTS ON THE HUMAN BODY EXTEND INTO FUTURE GENERATIONS, THE DAMAGE IS PASSED ON BY THE EXPOSED PARENTS, AS WE HAVE SEEN FROM NEVADA AND PACIFIC ISLANDS ATOMIC BOMB TEST SITES, FROM CHERNOBYL AND FROM RETURNING VETERANS WHO WERE EXPOSED TO DEPLETED URANIUM.

STOCHASTIC EFFECTS:
Stochastic effects have been defined as those for which the probability increases with dose, without a threshold. Nonstochastic effects are those for which incidence and severity depends on dose, but for which there is a threshold dose.
Effects produced at random without a threshold dose level, the probability of their occurrence being proportional to the dose and their severity being independent of it. In radiation safety, the main stochastic effects are carcinogenesis and genetic mutation.

BECAUSE BILLIONS OF DOLLARS ARE INVESTED IN THE 'NUCLEAR INDUSTRY', BILLIONS OF HUMAN LIVES NO LONGER MATTER TO INVESTORS.
THE GENERAL PUBLIC'S UNDERSTANDING OF RADIATION HAS BEEN COMPLICATED, PERHAPS INTENTIONALLY, BY THE NUCLEAR INDUSTRY SO WE DON'T WORRY OUR LITTLE HEADS ABOUT IT.
IN A SINGLE ARTICLE ABOUT RADIATION, IT IS NOT UNCOMMON TO SEE AT LEAST FOUR OR MORE METHODS CITED WHEN SPEAKING OF RADIATION.
CONFUSION IS GOOD FOR BUSINESS.
LET'S LOOK AT THE COMMON GEIGER COUNTER READINGS FOR THIS PAST WEEK ACROSS AMERICA, IN TERMS OF COUNTS PER MINUTE (CPM) LEVELS, AS REPORTED BY THE EPA, IF YOU CAN CALL IT REPORTING.
BUT LET'S FIRST TRY TO GET A GRIP ON WHAT THESE NUMBERS MEAN.
[MY NOTE: IF YOU JUST WANT THE READINGS, SCROLL DOWN TO THE TRIPLE ASTERISKS IN RED, WHICH WILL BE HIGHLIGHTED IN YELLOW, THUSLY, ***
Both CPM and CPS are the RATE of detection events registered by the measuring instrument, NOT the rate of emission from the source of radiation.
For radioactive decay measurements it must not be confused with disintegrations per unit time (dpm), which represents the rate of atomic disintegration events AT THE SOURCE of the radiation.
[SOURCE: Radiation Detection and Measurement, third edition 2000. John Wiley and sons]

ABOVE: DECAY, IONIZING RADIATION TRANSMISSION AND DETECTION.
[VERY LARGE IMAGE <HERE>]
REMEMBER THE READINGS/NUMBERS IN THE VIDEO AT THE TOP OF THIS BLOG ENTRY... 160-200+ CPMs.
What Are Counts Per Minute (CPM) in Radioactivity?
When/If you get a Geiger counter , you’ll need to know about CPM, which is the counts per minute that you’ll see displayed on the analog meter in addition to the corresponding level of radiation.
Once you get your CPM reading from your device, you then need to figure out what that reading means.
What are normal radiation levels CPM and what are dangerous ones?
If you have your Geiger counter calibrated to Cs137, which most are, 1 milliRad per hour would equate to 1,200 CPM on your counter.
At the same time, 1 microSievert per hour would equate to 120 CPM on the reading. These are more universal units of measurement that can help you better understand your radiation exposure.
A CPM reading of at least 100 is considered a warning level by the Radiation Network, although the length of time you’re exposed to the radiation is an important factor.
If you’re concerned about staying within safe radiation levels, it would take 432 days at a CPM of 100 to up your chance of getting cancer to odds of 1 in 1,000.
At higher exposure rates, it would take less time.
For instance, it would only take four days to increase your rate to those odds if you’re exposed to a level of 10,000 CPMs PER DAY.
KEEP THOSE NUMBERS IN MIND, PLEASE.
Radiation Units
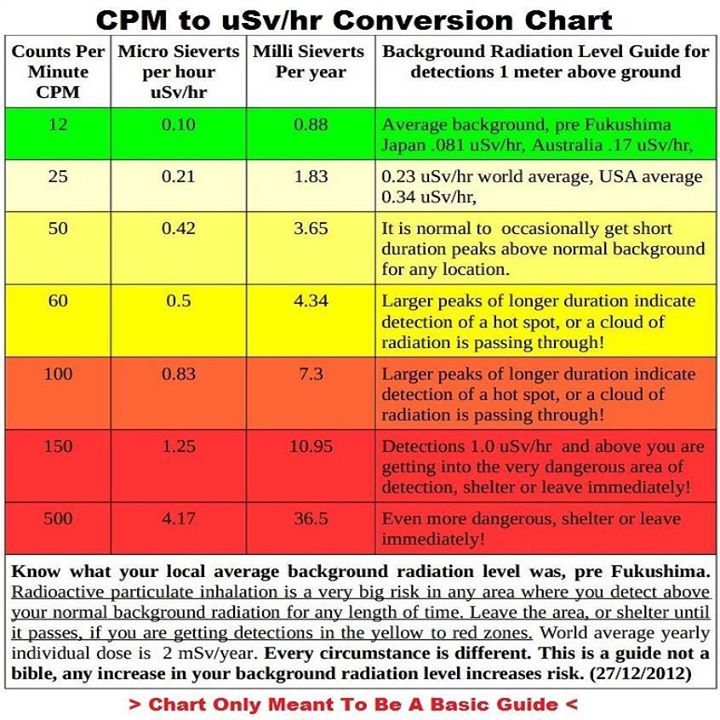
Radiation units are confusing. If you remember just one thing, remember that the "badness" in an area can be expressed as micro-Sieverts/hour (uSv/hr) -- i.e., how much "badness" per hour people in that area are getting.
It's cumulative, so if a person is in a 2 uSv/hr area for 6 hours, that's a 12 uSv dose they've accumulated.
Generally a person gets around 4 milli-Sieverts per year from natural sources (i.e. 4,000 uSv).
HOWEVER, the EPA limit for the general public for exposure per year ABOVE background level is "JUST" 1 milli-Sievert per year.
A 100 milli-Sievert dose (i.e. 100 x the EPA limit) is associated with a measurable increase in cancer.
A chest CT scan is about 7 milli-Sieverts of exposure.
ON THAT WEBSITE, NOTE THE FOLLOWING STATEMENT:
"Some scientists believe that low doses of radiation do not increase the risk of developing cancer at all, but this is a minority view."
THE ATOMIC ENERGY COMMISSION STATED DECADES AGO, AND THIS HAS NOT CHANGED, THAT THERE IS NO SUCH THING AS A HARMLESS DOSE OF RADIATION.
THE FDA ALSO HAS A SHORT SUMMARY PAGE THEY TITLED
"RADIATION PROTECTION TERMINOLOGY", BUT IT DOESN'T EXPLAIN MUCH.
MUST NOT PANIC THE SHEEP, RIGHT?
DO NOTICE THIS STATEMENT, THOUGH:
"Gamma rays are similar to X-rays, but are usually more energetic. It travels at the speed of light and is the most penetrating type of radiation. "
In the US, a radiation worker is permitted to get 50 milli-Sieverts per year of exposure. So we're ased to swallow hard and accept that exposure up to 1 milli-Sievert is quite safe, and up to 10 or 20 is "nothing to worry about" (lots of people get CT scans for example).
See the Free Radiation Unit Chart from XKCD
A BIG THANK YOU TO 'MAJIA'S BLOG' FOR THE FOLLOWING:
Converting CPM to MicroSieverts
"There is no direct equation because beta CPM (counts per minute) is an electron count and (micro and milli) sieverts is an account of bodily damage.
Still, in the post below I site an EPA guideline dictating an intervention level at 300 CPM or 10 microsieverts an hour
So, let us for a moment presume that the two are roughly equivalent in a hypothetical scenario that allows us to speculate on the health implications of our current levels of exposure.
If that were the case, exposure to 700 CPM would be roughly 23 microsieverts an hour. That would mean that we in Phoenix yesterday would have hypothetically received 552 microsieverts in a 24 hour period.
In 18 days at 700 CPM we would be at approximately 10 millisieverts of exposure (there are 1000 microsieverts in 1 millisievert) just from exposure to air alone.
We also are exposed to radiation from the machines in our environment, radon gas, food, etc.
These numbers are not looking good.
The EPA recommends that our exposure to background radiation should not exceed 100 millirem a year, which is 1 millisievert, although we ordinarily are exposed to about 300 millirem in the US from background (3 millisieverts). Considerable background radiation derives from nuclear power plants, past nuclear weapons testing and radon gas.
There is no "immediate" health risk from 18 days of exposure of 700 CPM in the sense that people not will develop radiation sickness at this level. However, cancer rates and other diseases have been proven to increase at every 3 millisievert increment over 10 millisieverts."
BE AWARE THAT MANY ARE "DEBUNKING" THE FOLLOWING READINGS FROM ACROSS THE U.S., STATING THAT THE EPA DOESN'T USE 'NORMAL' GEIGER COUNTERS.
FROM POPULAR MECHANICS, A GOVERNMENT-INFLUENCED CALMING MOUTHPIECE ("Don't worry, be happy!" is what they do best.) , WHICH ACTUALLY ADMITS THAT, "Japanese officials are surveying people leaving the affected areas, and anyone with more than 100,000 cpm of contamination is asked to change clothes (which removes up to 90 percent of the contamination) and possibly to shower."
ABOVE 100,000 CPMs?
HOW ABOUT A MILLION CPMs, 10 MILLION?
THEY NEGLECT TO TELL US WHAT WE SHOULD DO WHEN RADIATION SURROUNDS US EVERY HOUR OF EVERY DAY.
FROM THIS PAST WEEK, THE READINGS, "A LA EPA":
***HERE ARE LAST WEEK'S CPM READINGS.***
YOU DECIDE IF THIS SHOULD BE OF CONCERN TO US.
Published May 5, 2018
Gamma and Beta CPM by City and State in the US
| 27,314,896 | Withheld | 4/28/2018 | Colorado Springs, | CO. | 645,613 |
| 24,246,108 | Withheld | 4/28/2018 | Little Rock, | AR. | 699,757 |
| 24,199,642 | Withheld | 4/28/2018 | Raleigh, | NC. | 1,130,490 |
| 22,699,778 | Withheld | 4/28/2018 | Portland, | ME. | 514,098 |
| 22,445,047 | Withheld | 4/28/2018 | Navajo Lake, | NM. | Transient |
| 21,279,986 | Withheld | 4/28/2018 | Spokane, | WA. | 527,753 |
| 20,219,005 | Withheld | 4/28/2018 | Fresno, | CA. | 930,450 |
| 20,068,236 | Withheld | 4/28/2018 | St. George, | UT. | 138,115 |
| 19,618,543 | Withheld | 4/28/2018 | Riverside, | CA. | 4,224,851 |
| 19,437,835 | Withheld | 4/28/2018 | San Diego, | CA. | 3,095,313 |
| 19,201,280 | Withheld | 4/28/2018 | Atlanta, | GA. | 5,286,728 |
| 19,014,184 | Withheld | 4/28/2018 | Worcester, | MA. | 916,980 |
| 18,828,649 | Withheld | 4/28/2018 | Denver, | CO. | 2,543,482 |
| 18,230,282 | Withheld | 4/28/2018 | Tucson, | AZ. | 980,263 |
| 18,204,494 | Withheld | 4/28/2018 | Los Angeles, | CA. | 12,828,837 |
| 18,069,619 | Withheld | 4/28/2018 | Phoenix, | AZ. | 4,192,887 |
| 17,629,266 | Withheld | 4/28/2018 | Idaho Falls, | ID. | 133,265 |
| 17,454,461 | Withheld | 4/28/2018 | Grand Junction, | CO. | 146,723 |
| 17,375,606 | Withheld | 4/28/2018 | San Bernardino, | CA. | 4,224,851 |
| 16,701,423 | Withheld | 4/28/2018 | Boston, | MA. | 4,552,402 |
| 16,648,546 | Withheld | 4/28/2018 | Casper, | WY. | 75,450 |
| 16,607,028 | Withheld | 4/28/2018 | Yuma, | AZ. | 195,751 |
| 16,576,586 | Withheld | 4/28/2018 | Concord, | NH. | 146,445 |
| 16,446,672 | Withheld | 4/28/2018 | Bakersfield, | CA. | 839,631 |
| 16,384,602 | Withheld | 4/28/2018 | El Paso, | TX. | 622,263 |
| 16,003,798 | Withheld | 4/28/2018 | Oklahoma City, | OK. | 1,252,987 |
..........

SHOULD THE ABOVE IMAGES GO MISSING, THERE IS ALSO A VIMEO VIDEO OF THE ABOVE AT <THIS SITE>.
MR. BOB NICHOLS' INFORMATION FOR THIS WEEK MAY BE FOUND AT
https://www.veteranstoday.com/2018/05/05/million-a-week-club-yrtw-16/
PBS ALSO HAS A RADIATION DOSE CHART <HERE>.
CONSIDER THIS:
"Dose limits alone are not enough to ensure adequate protection. They function in combination with the fundamental principles of justification and optimization.
These limits apply only to doses received above the normal local natural background radiation.
Limits on effective dose, combined with optimization of protection, are designed to avoid a risk of stochatic effects that would be considered intolerable in a planned exposure situation.
Limits on equivalent dose to an organ, combined with optimization of protection, are designed to prevent the occurrence of deterministic effects.
Dose limits apply ONLY in planned exposure situations.
In other situations, restrictions on individual dose are called reference levels. They provide the additional flexibility needed in emergency and existing exposure situations to make sure protection is optimized.
Dose limits do not apply to medical exposures. If they did, the effectiveness of diagnosis or treatment might be reduced, doing more harm than good for the patient. The emphasis is on justification of medical procedures and optimization of protection."
ALSO CONSIDER THIS:
How Much Radiation Is Dangerous?
It depends on whom you ask. Some people will say no amount is safe, but that doesn’t really help us understand the relative dangers. Here are some basic numbers to use as a guide (μSv means microSieverts):
10 μSv – The average radiation you received today
40 μSv – The radiation you receive by taking a flight from New York to L.A.
100 μSv – The radiation you receive during a dental x-ray
800 μSv – Total radiation dose at Three-Mile Island for the duration of the accident
3,000 μSv – Radiation dose from a mammogram
3,600 μSv – Average radiation a US citizen receives in a year from all sources
50,000 μSv – Maximum allowable yearly occupational dose (USA)
100,000 μSv – Lowest yearly dose likely linked to increased cancer risk
2,000,000 μSv – Severe radiation poisoning (sometimes fatal)
One sievert is 1,000 millisieverts (mSv). One millisievert is 1,000 microsieverts.
SO THE RECENT READING OF 530 SIEVERTS AT ONE REACTOR IN JAPAN,
530 SIEVERTS, NOT MICROSIEVERTS, SIEVERTS per hour, and could be as high as 690 sieverts per hour, MEANS THAT IT WAS EMITTING AT LEAST 530,000.000 MICROSIEVERTS PER HOUR.
AND TEPCO ADMITTED THEY "FORGOT" TO TAKE THE COVER OFF THE MEASURING DEVICE!
THEY JUST ADMITTED THE SAME 'ERROR' 2 DAYS AGO WHEN ANOTHER HIGH READING WAS TAKEN INSIDE THE GROUNDS OF THE PLANT.
"Richard Black, director of the Energy and Climate Intelligence Unit, says that while the readings are not reliable, they still “demonstrate that, seven years after the disaster, cleaning up the Fukushima site remains a massive challenge — and one that we’re going to be reading about for decades, never mind years.”
Mycle Schneider, independent energy consultant and lead author of the World Nuclear Industry Status Report, criticized Tepco, saying the power company has “no clue” what it is doing.
“I find it symptomatic of the past seven years, in that they don’t know what they’re doing, Tepco, these energy companies, haven’t a clue what they’re doing, so to me it’s been going wrong from the beginning. It’s a disaster of unseen proportions.”
In observing the poor maintenance of plant radiation leaks, Schneider also pointed out that the company stores nuclear waste at the site in an inappropriate way.
“This is an area of the planet that gets hit by tornadoes and all kinds of heavy weather patterns, which is a problem. When you have waste stored above ground in inappropriate ways, it can get washed out and you can get contamination all over the place.”
FUKUSHIMA'S DAIICHI PLANT HAS AT LEAST TWO OTHER HEAVILY LEAKING REACTORS.
DO THE MATH...
The level of radiation detected at the Fukushima plant immediately after the third explosion in 2011 was 400,000 μSv/h–a level that would be extraordinarily dangerous for humans.
By comparison, that level of radiation is 33,000 times higher than recorded about 750 yards from the containment facility at reactor 4 in Chernobyl.
Here’s the data from Fukushima in 2011:
"Live: 196 locations by crowd-sourced Geiger counters
Futaba, Fukushima, Japan
Median reading in this area is approximately328.000 µSv per hour ( 2873280.000 µSv per year ).
4049.38272 times the average public space Geiger counter reading for Japan (0.081 µSv per hour)*
328.000% the radiation dose you would receive from a chest x-ray (100 µSv)*
Current reading: 328.000 µSv per hour Time: 2011-07-14 13:06:3 "
DOES ANYONE ELSE GET SICK OF HEARING ONLY ABOUT CESIUM, AND SOMETIMES TRITIUM AND STRONTIUM FROM FUKUSHIMA?
THERE ARE A LOT MORE RADIOACTIVE ISOTOPES TO BE CONCERNED ABOUT THAN THOSE TWO.
THIS is full list of MAN MADE radionuclides: http://www.life-upgrade.com/DATA/inventory-reactor-beznau2.jpg
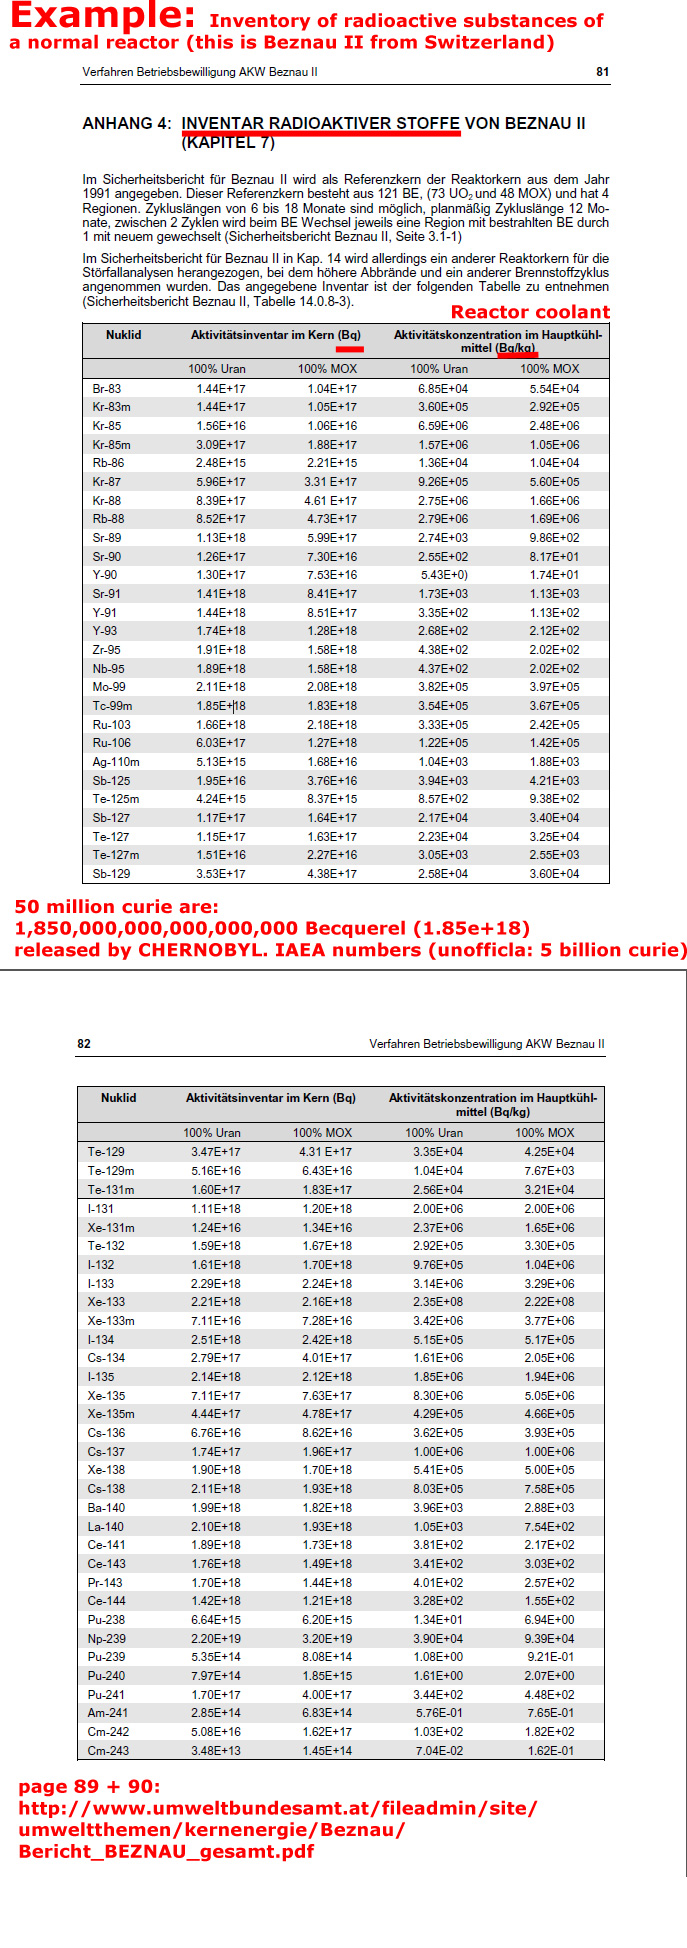
Trillions and trillions of Becquerels are emanating from only ONE reactor at Fukushima today.
"At a ratio of 1:1, Plutonium-239 releases are also 7.6 x 10^13, or 76 tera(trillion)becquerels.
23,000 higher than previous gov’t estimate.
[…] According to the June 6 estimate by the NISA [see chart below]: Plutonium-239: 3.2×10^9 [3.2 billion becquerels] […]
The amount of plutonium-239 has increased 23,000-fold. […]
Fukushima I Nuke Plant: 154 Terabecquerels Per Day, Every Day of radioactive iodine and cesium still spewing out of the plant, Japan’s Nuclear Safety Commission now admits.
[…] From Yomiuri Shimbun (9:15PM JST 4/23/2011)
"The Nuclear Safety Commission under the Prime Minister’s Office disclosed on April 23 that the amount of radioactive materials being released from the TEPCO Fukushima I Nuclear Power Plant was 154 terabecquerels per day (1 tera is 1 trillion) as late as April 5 when the amount being released was considered stabilized.
On April 5, the estimated amount of radioactive materials released from Fukushima I Nuke Plant was 0.69 terabecquerels/hour for iodine-131 and 0.14 terabecquerels/hour for cesium-137. When the numbers were recalculated according to the INES method (converting cesium amount into iodine equivalent), the amount released turned out to be 6.4 terabecquerels/hour (which was 154 terabecquerels per day. Previously, the Nuclear Safety Commission had simply added the numbers for iodine-131 and cesium-137, and announced it was less than 1 terrabecquerel per hou."
WHAT WOULD BE THE TOTAL IF TEPCO/THE ABE REGIME HONESTLY REPORTED ON ALL REACTORS, ALL HOLDING TANKS, ALL WATER BEING DUMPED INTO THE PACIFIC ALL DAY, EVERY DAY, ALL THOSE MILLIONS OF BAGS OF CONTAMINATED SOIL AND UNDERBRUSH, ETC, SCATTERED ACROSS JAPAN, AND ALL THE INCINERATORS BURNING RADIOACTIVE WASTE EVERY SINGLE DAY?
LIES THE MEDIA AND BIG NUKE'S "EXPERTS" TELL US...
1- SOME RADIATION IS SAFE AND MAY EVEN BE 'GOOD FOR YOU'.
THAT'S A LIE.
2- CHERNOBYL WAS WORSE THAN FUKUSHIMA.
THAT IS A BIGGER LIE.
In 1970 it was proven that a human fetus is 500 times more vulnerable to radiation than anyone else. And in 1978 this was released in the bulletin of atomic scientists:
"CANCER AND LOW-LEVEL IONIZING RADIATION"
THERE IS NO SAFE LEVEL OF RADIATION.
ICRP, International Commission on Radiological Protection , which is very PRO-Nuke, confirmed in 1966 that natural radiation is harmful.
ICRP Publication Number 8 from 1966 on page 60: "... in relation to the health damage caused by natural radiation for the bulk of the world’s population is a risk of sixth order (1 to 10 dead per million per rad / gray); in a few areas with high natural background radiation the risk fifth order. 10 to 100 dead per million and rad (gray). and in 1977 the ICRP publication number 26 said, that, in this sense, regional differences of the natural radiation are so regarded, that the corresponding differences include the damage. and in the ’80s the natural radiation was simply doubled. and in 2011 it became the twentyfold in japan: 20 mSv/a. Natural radiation is used as an excuse to increase artificial radiation with radionuclides from reactors.
They call that radiation-protection?
Prof. Ernest Sternglass and his studies about infant mortality near reactors showed how little it takes to damage a human fetus/babies;: http://www.ratical.org/radiation/inetSeries/ejs1192.html
"JUST" 17 milliSieverts per year means:
16,000 – 32,000 additional cancer deaths AND 150,000 – 1,5 million deaths by genetic diseases: by John W. Gofman (one of the original scientists who gave us nuclear bombs) , Ph.D., M.D and Arthur R. Tamplin, Ph.D. quote:
“If we use the most optimistic Russell mouse genetic data, and even if we give full credit for slow delivery of radiation, we reach the conclusion that 100,000 extra genetic deaths per year would occur for the allowable average exposure of 170 millirads to the population. This can hardly be construed as an “optimistic” outlook, or a “safe” dose of radiation.”
Professor Yuri Bandazhevsky, a pathologist, Rector of the Medical Institute of Gomel, on the ingestion of radio caesium includes – he said: “Clinical checks on children between 1996 and 1999 show that at levels greater than 50Bq/kg there are pathological changes in vital organs and systems – cardiovascular, nervous, endocrine, immune, reproductive, digestive excretory and eyes. Caesium concentrations in the placenta reveal a relationship with nervous system defects in the foetus. The health condition of the population is a disaster but being a physician myself I cannot accept it as hopeless. With all my faith in God and life I appeal to anyone who can influence it: do your best to improve the situation. There is nothing more precious on this planet than life. And we should do everything possible to protect it.”
See: http://www.spokesmanbooks.com/Spokesman/PDF/91Gifford.pdf
Clause 12 of the Executive conclusion of the Recommendation of the European Committee for radiation risks declares: “…Total maximal permitted dose from all human-caused sources should not exceed 0.1 mSv for population and 5 mSv for personnel”.
This publication is declared by the European Committee for radiation risks as “regulating”. It is only common sense that we should follow the recommendations given in this publication by the scientists from Canada, Norway, Great Britain, Denmark, Switzerland, the USA, Ireland, Sweden, Germany, France, India, Belarus, Finland and Russia.
See: page 16 http://independentwho.org/media/Documents_IW/Forum_Radioprotection_English_Abstracts_IW_2012.pdf
“…To provide an adequate safety standard the dose limit of 1 mSv/y have to be reduced to 0.02 mSv/y or 20 µSv/y.”Page 9: http://www.staff.uni-marburg.de/~kunih/all-doc/stoakuni.pdf by Dr. Horst Kuni, Nuclear Medicine, University Professor.
“European Parliament hears criticisms of radiation protection standards, but don’t publish findings” Brussels 1998: page 35 for example: Childhood leukemia caused by normal reactor operation: http://www.llrc.org/health/subtopic/stoaabstracts.pdf
DOSE AND DOSE RATE , from Geiger Counter Bulletin
There is a lot of confusion going on these days about Dose and Dose Rate. Japan data are generally reported in mSv/hr (milliSieverts per hour) or just plain mSv. When data is properly communicated mSv/hr indicates rate. It’s like driving a car at 50 kilometers per hour. In an hour you will have driven 50 kilometers. If you are exposed to 1 mSv (one milliSievert) per hour for one hour, you will get a dose of 1 mSv.
The amount of radioactivity in a given volume of air, water or tissue is generally expressed in becquerels (Bq). One becquerel means one disintegration (radiation event) takes place every second. So when you hear a sample of water contains 10,000 becquerel of a certain isotope per cubic centimeter it means every second 10,000 radioactive events are happening in that sample.
When translating from Bq to dose or dose rate, it is important to understand the capabilities of the detector and the characteristics of the radiation. Alpha radiation is considered to be 20 times more harmful than beta, gamma, x radiation. It is also not detected by many instruments. The same holds true for beta and neutron radiation. So dose and dose rate can be under-reported if the capabilities of the instrument are not understood. In an emergency situation, confusion and danger can often lead to misinterpretation, or improper reporting of data. It is important to know how to ask the right questions about the data.
Here’s a quick guide to understanding the terminology:
Activity (quantity) is measured in Becquerel (Curies in the U.S.)
Absorbed Dose is measured in gray (Gy) (Rads in the U.S.)
Dose Equivalent is measured in sievert (Sv) (Rem in the U.S.)
Converting between Conventional Units (used in U.S.) and SI Units (used in Japan and Europe)
To convert millirems (mrem) to microsieverts (uSv) multiply by 10.
To convert microsieverts to millirem multiply by 0.1
Caution: Geiger Counters that are energy compensated do not detect alpha and beta radiation, so any dose rate or dose information will not include alpha or beta dose (only energetic gamma).
Geiger Counters with mica windows will detect alpha and beta, but calibration accuracy in mR/hr or uSv/hr will be affected by the mix of radioactive materials present.
Scientists: Far more cesium released than previously believed
Source: Asahi AJW
Author: By AKIKO OKAZAKI / Staff Writer
Date: February 29, 2012
"A mind-boggling 40,000 trillion becquerels of radioactive cesium, or twice the amount previously thought, may have spewed from the crippled Fukushima No. 1 nuclear power plant after the March 11 disaster, scientists say.
Michio Aoyama, a senior researcher at the Meteorological Research Institute, released the finding at a scientific symposium in Tsukuba, Ibaraki Prefecture, on Feb. 28.
The figure... is twice as large as previous estimates by research institutions both in Japan and overseas. […] While the latest study said 15-20 quadrillion becquerels of cesium-137 was released into the atmosphere, the Japan Atomic Energy Agency [under-] estimated the amount at 8.8 quadrillion becquerels."
AS I SAID, WE EACH WILL DECIDE HOW MUCH RADIATION IS ACCEPTABLE TO US, AND WE'LL ALSO DECIDE IF READINGS 7, 8, 10 TIMES BACKGROUND RADIATION POSE NO THREAT OR POSE TOO GREAT A THREAT..
WHAT IS CERTAIN IS THAT FUKUSHIMA RADIATION IS WITH US FOR AT LEAST 100 MORE YEARS, AND SOME OF THE FALLOUT WILL REMAIN TO PLAGUE US FOR MANY THOUSANDS OF YEARS.
FOR ME, FOR THOSE I LOVE, A READING OF 0.0000000000000001 MICROSIEVERTS PER YEAR IS TOO MUCH.
AND A READING OF OVER 10 MILLION CPMs SIGNIFIES AN ACT OF WAR.
BEFORE 2011, BEFORE THE DISASTER IN JAPAN, WE DID NOT SEE READINGS THAT HIGH HERE.
BEFORE WE BEGAN TO CREATE THE NUCLEAR BOMB AND WITH IT, NUCLEAR ENERGY/POWER PLANTS, WE DID NOT SEE THE HIGH NUMBERS OF BIRTH DEFECTS AND CANCERS WE SEE TODAY.
________________________________
ADDENDUM:FUKUSHIMA IS WORSE THAN CHERNOBYL.
Counterpunch 27th April 2018:
"The radiation dispersed into the environment by the three reactor meltdowns at Fukushima-Daiichi in Japan has exceeded that of the April 26, 1986
Chernobyl catastrophe, so we may stop calling it the “second worst”
nuclear power disaster in history. Total atmospheric releases from
Fukushima are estimated to be between 5.6 and 8.1 times that of Chernobyl,
according to the 2013 World Nuclear Industry Status Report. Professor Komei
Hosokawa, who wrote the report’s Fukushima section, told London’s
Channel 4 News then, “Almost every day new things happen, and there is no
sign that they will control the situation in the next few months or years.”
https://www.counterpunch.org/2018/04/27/move-over-chernobyl-fukushima-is-now-officially-the-worst-nuclear-power-disaster-in-history/
BELOW IS JUST ONE SMALL AREA OF JAPAN WITH MILLIONS OF BAGS OF CONTAMINATED SOIL, BAGS THAT ARE CURRENTLY BREAKING APART, BAGS THAT DON'T CONTAIN THE RADIATION WITHIN.
//WW
No comments:
Post a Comment