
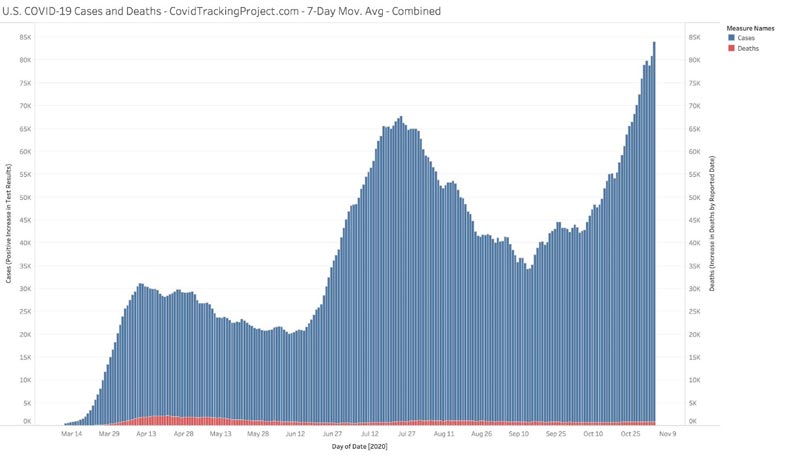
It's at the bottom of the graph of 'cases'...barely.
It was widest back in April/May, hadn't widened in the past several months.
Globally, as of 3:02pm CET, 5 December 2020, there have been 65,257,767 confirmed cases of COVID-19, including 1,513,179 deaths, reported to WHO.
In the United States of America, from January 3, 2020 to 3:02pm CET, to 5 December 2020, there have been 13,978,171 confirmed cases of COVID-19 with 274,077 deaths ATTRIBUTED to COVID.
BELOW: TOTAL U.S. MORTALITY RATE (ALL DEATHS) FROM BEFORE COVD-19 (2017, 2018) TO SEPTEMBER, 2020...

THE SPIKE IN 2018 WAS FROM A PARTICULARLY BAD FLU SEASON.
NOTE FEWER TOTAL DEATHS IN AUGUST AND SEPTEMBER 'ESTIMATES' THAN DEATHS IN 2017/2018.
CDC MUST HAVE FORGOTTEN THEY POSTED THE ABOVE CHART BECAUSE THE ONE THEY HAVE UP NOW IS DIFFERENT.
THEY COVER THEIR BUTTS, THOUGH, BY STATING DATA CAN BE CHANGED WHEN MORE REPORTS COME IN, ETC.

TOTALS FOR COVID ARE FROM JULY, 2020.
FROM LEFT TO RIGHT, THE COLUMNS REPRESENT...
- FIRST COLUMN, AVERAGE GLOBAL INFLUENZA (FLU) FATALITIES
- SECOND COLUMN, TOTAL GLOBAL COVID-19 DEATHS
- THIRD COLUMN, TOTAL U.S. FLU DEATHS, 2017-2018
- FOURTH COLUMN, U.S. FLU DEATHS 1957-1958 (ASIAN FLU)
-FIFTH COLUMN, U.S. FLU FATALITIES 1968-1969 (HONG KONG FLU)
- SIXTH COLUMN (LAST COLUMN ON RIGHT), TOTAL U.S. COVID-19 FATALITIES AS OF JULY, 2020.
The WHO identifies the upper bound of a normal flu season to be around 650,000 fatalities.
"The 2009 “Swine flu” A(H1N1) pandemic started in Mexico... and spread rapidly to over 214 countries and overseas territories or communities. Between 105,000 and 395,000 people are thought to have died.
Even so, the world was relatively lucky: it turned out to be milder than some seasonal epidemics, which can kill twice that number."
I was a 10+-year-old youngster in 1957 and was 20+ years old in 1968, and I don’t think it occurred to anyone to blame the virus on the government or the President. Nor was there any hysteria about the government’s “response” to the virus. It was assumed, sensibly, that you can pass all the laws you want, but the virus won’t obey them.
The world did not end either time and we just went about our daily lives, waiting it out.
This time it's different, as we have all seen.
For the most part, hysteria over the coronavirus is simply political opportunism. But it also reflects a childish assumption, which pervades U.S. politics, that every single thing that goes wrong is somehow the government’s responsibility, and it's up to the government to fix it.
'Uncle Sam' plays the hero.
This is why we see such mad scrambling at every level of government to “do something” about the coronavirus, see the blame by the media of the Trump administration.
'Uncle Sam' plays the hero.
This is why we see such mad scrambling at every level of government to “do something” about the coronavirus, see the blame by the media of the Trump administration.
But there is little evidence that anything governments do will make much difference.
Not masks, nor social distancing, nor total shut-down and stay-home for the entire country will stop something too small to trap or contain.
MAYBE governments could keep COVID out of nursing homes?
Doesn't appear they can, and their failure to do so shows in the continuing horrific numbers of nursing home deaths in states like New York, Minnesota and Washington.
In the DATA TABLE found <HERE>, you can see how far more deaths in the U.S. are listed as COVID deaths than any other nation on earth; 100,000 more than second-place Brazil, about 135,000 more deaths than in India, whose population is over one billion people, and U.S. deaths are 232,00 more than all of Russia...
HOW is that possible?
STRAIGHT OFF THE CDC's WEBSITE:
"Nationally, surveillance indicators tracking levels of SARS-CoV-2 virus circulation and associated illnesses have been increasing since September.
[GIVE COVID A BOOST BY ADDING COMORBIDITIES.]
HOW is that possible?
STRAIGHT OFF THE CDC's WEBSITE:
"Nationally, surveillance indicators tracking levels of SARS-CoV-2 virus circulation and associated illnesses have been increasing since September.
[GIVE COVID A BOOST BY ADDING COMORBIDITIES.]
The percentage of deaths due to pneumonia, influenza and COVID-19 (referred to as PIC by CDC) increased during October and through mid-November. Both COVID-19-associated hospitalizations and PIC mortality for the most recent weeks are expected to increase as more data are received.
[CDC's "imaginary numbers", with no apology when they'r wrong.]
"Nationally, the overall percentage of visits to outpatient providers or emergency departments (EDs) for influenza-like illness (ILI) AND COVID-like illness (CLI) has been increasing since mid-September;
Based on death certificate data, the percentage of deaths attributed to PIC for week 48 was 12.8% and, while declining compared with week 47 (18.6%), remains above the epidemic threshold."
[DEATHS DECLINED, BUT DON'T LOOK AT THAT FACT.]
Based on death certificate data, the percentage of deaths attributed to PIC for week 48 was 12.8% and, while declining compared with week 47 (18.6%), remains above the epidemic threshold."
[DEATHS DECLINED, BUT DON'T LOOK AT THAT FACT.]
LIKE I SAID, THEY'RE COUNTING PNEUMONIA, INFLUENZA AND COVID (PIC) TOGETHER. THEY'RE TELLING THE MEDICAL COMMUNITY TO "USE PROFESSIONAL DISCRETION TO DECLARE CAUSE OF DEATH" AND USE THAT NEW CODING,
"The percentage of specimens testing positive for SARS-CoV-2 has been increasing since September.
The percentages of visits to EDs or outpatient providers for ILI and CLI, and COVID-19-associated hospitalization rates have been increasing since September.
The percentage of deaths due to PIC has been increasing since the beginning of October. The percentages for [weeks] 46 and 47 now exceed the percentage of deaths due to PIC observed during the summer peak.
[NOT TRUE!
New Evidence Suggests Better Treatment Is Contributing to Falling COVID-19 Fatality Rates
"The fatality rate among COVID-19 patients in the United States has fallen dramatically since last spring, from 6.1 percent in mid-May to 2.6 percent yesterday.
Even after adjusting for age and comorbidities, researchers in New York and England found large improvements in patient survival."
"Changes in demographics and severity of illness at presentation did not fully explain decreases in mortality seen over time," Lisa Horwitz and her collaborators note in the Journal of Hospital Medicine. "Even after risk adjustment for a variety of clinical and demographic factors, including severity of illness at presentation, mortality was significantly and progressively lower over the course of the study period."
Stats reported 10.29.2020.]
83,949,946 specimens were tested for SARS-CoV-2 using a molecular assay since March 1, 2020.
Nationally, during week 48, of 3,005,511 specimens tested for SARS-CoV-2 for diagnostic purposes, 350,378 (11.7%) were positive.
The percentages of specimens testing positive for SARS-CoV-2 increased in nine of ten HHS regions."
BROOKINGS INSTITUTE IS NOT IMPRESSED WITH CURRENT TESTING.
Nationally, during week 48, of 3,005,511 specimens tested for SARS-CoV-2 for diagnostic purposes, 350,378 (11.7%) were positive.
The percentages of specimens testing positive for SARS-CoV-2 increased in nine of ten HHS regions."
BROOKINGS INSTITUTE IS NOT IMPRESSED WITH CURRENT TESTING.
"[O]ver-reliance on biomedical tests results in risky public health behaviors.
Frequent Testing Emboldens Unsafe Behavior.
New case clusters underscore that excellent access to screening tests is insufficient to prevent significant outbreaks.
...individuals undergoing a preventive health intervention (in this case, screening) will engage in risky behavior because they assume they are not infectious – and that making this cognitive error is not rare.
The most relevant difference is not necessarily in the ability to detect positive cases (sensitivity), negatives cases (specificity), or any other analytical parameter of the assay.
Rather, the key point is the effect of pre-test probability – the prevalence of COVID-19 in the target population – on the proportion of erroneously positive test results."
WTH, BROOKINGS?
IF POSITIVE TESTS INCREASED AS CDC STATES, THEN OVERALL TESTING INCREASED IN 9 OF 10 REGIONS AS WELL, BUT THEIR GRAPH SHOWS FEWER TESTS NOW THAN BACK ON WEEK 14... WHEN 4,500,000 WERE TESTED WITH LESS THAN 5% POSITIVE?
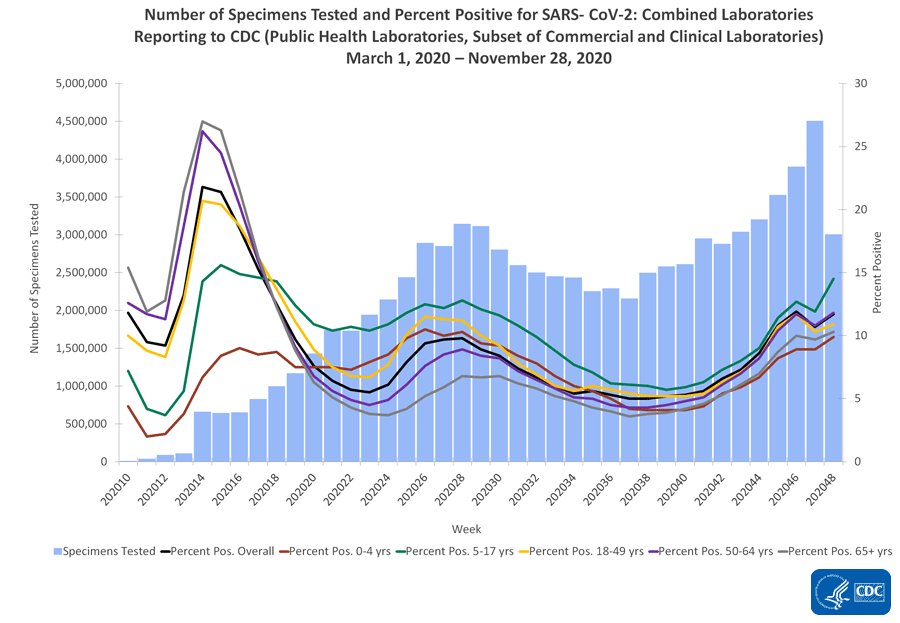 ON WEEKS 28 AND 29, MORE TESTS WERE POSITIVE THAN NOW.
BUT...BUT...THE VIRUS IS RAMPANT?
OBVIOUSLY NOT SO MUCH.
THE CHART SHOWS VALUES FROM MARCH 1, 2020 TO NOVEMBER 28, 2020.
To see the chart legend better, what each colored line indicates,
BUT...BUT...THE VIRUS IS RAMPANT?
OBVIOUSLY NOT SO MUCH.
THE CHART SHOWS VALUES FROM MARCH 1, 2020 TO NOVEMBER 28, 2020.
To see the chart legend better, what each colored line indicates,
<GO HERE>.
Back in June of this year, MSN questioned if hospitals may have FINANCIAL INCENTIVE to list deaths as COVID deaths.
[The answer is YES, as the director of the CDC, Robert Redfield, stated to Congress in August.]
FROM THE MSN ARTICLE:
“There's a lot of controversy about how many cases are actually attributed to COVID,” said Dr. David Holcombe, medical director of the CENLA Office of Public Health.
Many family members of those who have passed away in recent months have claimed that doctors have falsely listed the cause of death as COVID-19.
It also creates the question: what should be on the death certificate of someone with pre-existing conditions who was also diagnosed with the virus?
“Having COVID on there [on the death certificate], if the person was COVID positive, there's nothing actually wrong with that,” Holcombe said. “Actually determining the cause of death - the cause of death may have been respiratory failure associated with COVID and so forth. So, it becomes a contributing factor anyway. So, there's nothing actually wrong with that if it allows for some additional reimbursements.”
Overall, funds that the hospital receives for COVID-19 deaths are more [for] the greater good and the good of the patients' families.
“If that [COVID-19] appears as a diagnosis on a death certificate, I wouldn't make a big deal out of it because it's actually trying to be helpful,” Holcombe said.
[IT IS NOT HELPFUL TO THE FAMILIES WHO KNOW THEIR LOVED ONES DID NOT DIE BECAUSE THEY HAD A POSITIVE CoV-19 TEST!]
Coronavirus response team member Dr. Deborah Birx suggested in May that [COVID] deaths are being overcounted by 25%.
An investigation in Florida found that several deaths were wrongly attributed to the virus, including the case of a man who died from a gunshot wound to the head, and a man who died in a motorcycle accident.
The CDC’s own website lists over 8,900 coronavirus deaths characterized as "intentional and unintentional injury, poisoning and other adverse events."
SAME PAGE LISTS 11,724 "CODED AS COVID-19" DEATHS AS MALIGNANT NEOPLASMS.
Deaths with confirmed or presumed COVID-19, coded to ICD–10 code U07.1.
THE CDC STATES: "The off-cycle release of code U07.1, COVID-19, is unprecedented and is an exception to the code set updating process established under the Health Insurance Portability and Accountability Act (HIPAA)."
On CDC's FAQ page:
Question: "the World Health Organization (WHO) has approved an emergency ICD-10 code of “U07.2 COVID-19, virus not identified.” Is code U07.2 to be implemented in the US too? (3/26/2020)
Answer: The HIPAA code set standard for diagnosis coding in the US is ICD-10-CM, not ICD-10. As shown in the April 1, 2020 Addenda on theCDC website, the only new code being implemented in the US for COVID-19 is U07.1.
OVER AND OVER AGAIN ON THAT FAQ PAGE, PHYSICIANS ARE TOLD TO "Assign code U07.1, COVID-19, as the principal diagnosis".
In Texas, more than 3,000 people were recently removed from the overall coronavirus count because they were never actually tested but merely considered “probable” cases.
AGAIN, FROM CDC:
"Data on all deaths excluding COVID-19 exclude deaths with (CODE) U07.1 as an underlying or multiple cause of death.
Weighted estimates may be too high or too low in certain jurisdictions where the timeliness of provisional data has changed in recent weeks relative to prior years. Data for jurisdictions where counts are between 1 and 9 are suppressed."
Hospitals are paid more for Medicare patients confirmed or presumed to have coronavirus
"Medicare functions by paying hospitals a fixed sum depending on which diagnosis the Medicare Severity Diagnosis Related Group (MS-DRG) it falls under.
Recent federal legislation, known as Coronavirus Aid, Relief and Economic Security Act, or CARES Act, has provisions that enable the government to pay more to hospitals specific to the coronavirus pandemic."
Do other respiratory viruses circulate during the flu season?
CDC STATES: "In addition to flu viruses, several other respiratory viruses also circulate during the flu season and can cause symptoms and illness similar to those seen with flu infection. These respiratory viruses include rhinovirus (one cause of the “common cold”) and respiratory syncytial virus (RSV), which is the most common cause of severe respiratory illness in young children as well as a leading cause of death from respiratory illness in those aged 65 years and older."
TO SEE THE LATEST ON INFLUENZA HOSPITALIZATIONS, SEE CDC's INTERACTIVE GRAPH AND DATA AT https://gis.cdc.gov/GRASP/Fluview/FluHospRates.html
GIVEN ALL OF THE ABOVE, WHAT IS THE POINT IN CONTINUING TO LOCK-DOWN THE WORLD AND DESTROY LIVES?
THE POINT IS TO CREATE TOTAL SUBMISSION.
DO YOUR OWN SEARCH AND SEE HOW MEDIA FEAR TACTICS AND HYPED REPORTS HAVE INCREASED SINCE THE ELECTION.
TRUMP IS OUT, BUT THE MASSES ARE STILL FIGHTING AGAINST LOCK-DOWN.
THE GLOBAL "RESET BUTTON" WON'T BE ACCEPTED UNLESS THE MASSES STOP FIGHTING LOCK-DOWN AND ALL THAT COMES WITH IT.
A TRULY UNCONTROLLED, REALLY DEADLY VIRUS WOULD HAVE WIPED OUT FAR MORE THAN CV-19 HAS IN A YEAR AND 2 MONTHS.
LOOK AT THE SPANISH FLU.
WE WILL EITHER "HEAR AND OBEY" OR CONTINUE THE SHAM.
____________________________
There is a more recent 'confirmed positive PLUS PRESUMED positive' to deaths ratio chart at https://www.statista.com/statistics/1101932/coronavirus-covid19-cases-and-deaths-number-us-americans/ ...
ReplyDeleteAs anyone can see, the ratio does NOT equate to the hype the media is blasting at us each day. ANY death is tragic and grievous, but this virus is NOT on the order of deadly that we're being led to believe.
Other charts and data available at https://covidgraph.com/.
Look especially at the number of RECOVERED & see if you can find a breakdown of ASYMPTOMATIC positives compared to those WITH symptoms.
Too much missing important data.
Too little hard facts & too much ESTIMATING/GUESSWORK.